-
-
-
-
-
-
-
Enterprise
Resource Planning (ERP) software is designed to automate internal business’
processes. In the attempt to accomplish the ERP mission it has
become unclear what exactly is meant by the term ERP.
We feel IDC gives a good definition: an ERP product is one that
helps automate a company's business process by employing an integrated
user interface, an integrated data set, and an integrated code set.
In laymen’s terms it attempts to integrate all departments and functions
across a company onto a single computer system that can serve all those
different departments' particular needs and runs off a single database
so that the various departments can more easily share information and
communicate with each other. The areas where ERP applied in a organization
is shown in fig.1.

Fig.1
Enterprise resource management as a part of a successful E-business
model ( AMR
Research)
According
to Gartner's The Large-Enterprise,
Asset-Intensive ERP II MQ 4Q01 report, Features that characterize
a leading ERP package are the following:
Traditionally
when most people referred to the "core" ERP applications or "modules,"
they mean the back-office capabilities to manage human resources, accounting
and finance, manufacturing, and project-management functions. However,
major ERP suites from the likes of Oracle,
PeopleSoft, and SAP now provide much more--including modules
for sales force automation, business intelligence, customer relationship
management, and supply chain management.
Market
Analysis
According
to the AMR research, ERP market in 2000 grew 4%, from $17.9B
to $18.6B,the real story lies beneath the surface. While the traditional
ERP market, which includes standalone financials and human resources
grew at only 3%, licenses for strategic extensions like CRM, SCM, procurement,
and B2B commerce platforms, grew 61%. This trend will continue through
2005, at which point the strategic extensions will overtake core ERP
itself, creating a total market of $35.7B.
Historically,
ERP systems have been costly and time-consuming investments with implementation
extending over one and a half years. In a survey of 63 companies,
Meta Group found that the average total cost of ownership was $15 million
for an ERP project when all of the costs such as hardware, software,
employee time, and consultant time are included.2
Looking
forward, there remains much uncertainty with regard to the rate of growth
in this market. A recent study by Merrill Lynch predicts 3% growth
in IT spending with strong growth likely to occur in ERP, Web Development,
and storage. 3 One positive trend for the larger ERP and
IT providers is the corporate preference for large stable suppliers
in times of uncertainty.
Three
companies, SAP, Oracle and Peoplesoft, dominate the market for ERP software.
Together these companies account for over 55 percent of the market sales
in 2000 according to AMR Research (see chart below for additional competitors).
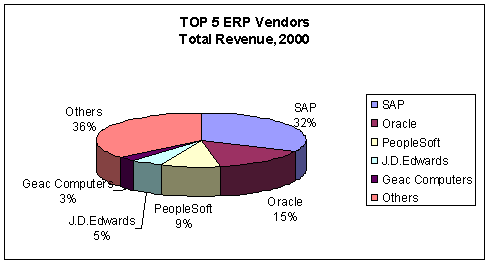
Fig.2
Major ERP Players ( AMR
Research 2001)
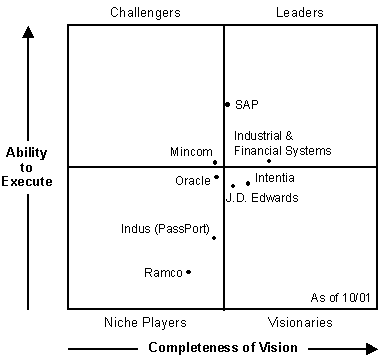
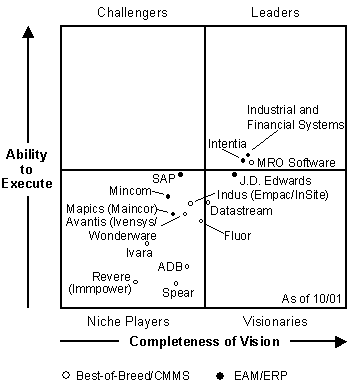
The
Magic Quadrant is Gartner's opinion and is an analytical representation
of a marketplace at and for a specific time period. It measures vendors
against Gartner-defined criteria for a marketplace. The positioning
of vendors within a Magic Quadrant is based on the complex interplay
of many factors. According to Gartner's The Large-Enterprise,
Asset-Intensive ERP II MQ — 4Q01 and Midmarket, Asset-Intensive
ERP II/EAM/CMMS MQ — 4Q01 report, the magic quadrant for Q4 2001
for ERP vendors is as follows:
Fig
3 Magic Quadrant for Large Enterprise ERP vendors
Fig
4 Magic Quadrant for Medium and Small Enterprise ERP vendors
Detailed Financial Comparison
Table
| |
|
|
SAP
|
Oracle
|
Peoplesoft
|
| |
|
|
1 year
|
3 year
|
1 year
|
3 year
|
1 year
|
3 year
|
|
Growth
(1 & 3 year)
|
|
|
|
|
|
|
| |
Sales
|
|
17.2%
|
18.4%
|
7.2%
|
15.0%
|
19.4%
|
12.0%
|
| |
Net
Income
|
-5.7%
|
3.3%
|
-59.3%
|
46.6%
|
31.5%
|
11.0%
|
| |
R&D
Expense
|
-7.3%
|
-
|
12.7%
|
16.6%
|
-6.7%
|
7.9%
|
| |
|
|
|
|
|
|
|
|
| |
|
|
FY 2001
|
FY2000
|
FY 2001
|
FY2000
|
FY 2001
|
FY2000
|
|
Margins
|
|
|
|
|
|
|
|
| |
Gross
Margin
|
61.2%
|
60.5%
|
74.3%
|
71.0%
|
58.9%
|
56.4%
|
| |
Operating
Margin
|
17.9%
|
12.8%
|
34.8%
|
30.4%
|
12.2%
|
4.1%
|
| |
Pretax
Margin
|
7.9%
|
9.8%
|
23.6%
|
62.2%
|
9.2%
|
8.4%
|
| |
Net
Profit Margin
|
8.1%
|
9.9%
|
23.6%
|
62.2%
|
9.2%
|
8.4%
|
| |
|
|
|
|
|
|
|
|
|
Returns
|
|
|
|
|
|
|
|
| |
Return
on Equity
|
19.3%
|
22.5%
|
40.2%
|
124.0%
|
14.6%
|
16.3%
|
| |
|
|
|
|
|
|
|
|
|
Leverage
& Risk
|
|
|
|
|
|
|
| |
Debt
to Equity
|
0.00
|
0.00
|
0.05
|
0.05
|
0.00
|
0.07
|
| |
Beta
|
|
1.501
|
|
1.809
|
|
1.837
|
|
Source:
http://www.onesource.com/
Stock
Performance
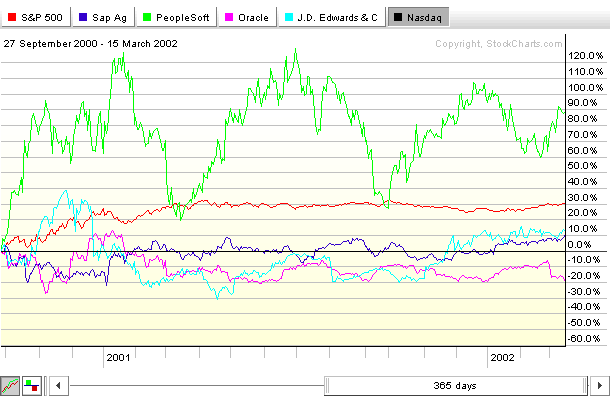
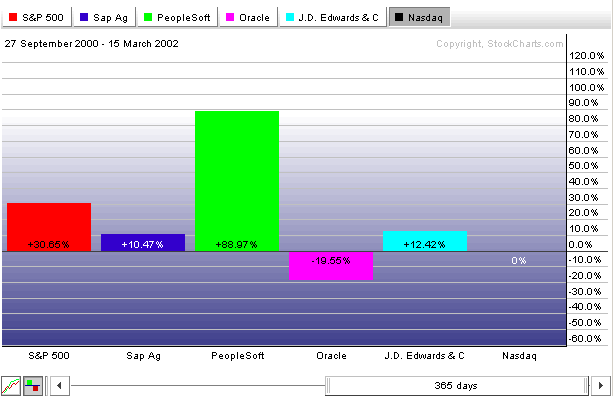
Source:
http://www.stockcharts.com/
BACK
TO THE TOP
Typical
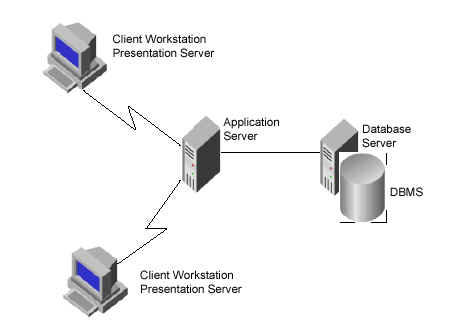
Architecture:
Fig
5 3-Tire architecture of an ERP system
The
ERP system components perform the following functions:
Database Server:
The database server stores all of the persistent data in an ERP
system.
Application
Server. The application server connects to the database server,
and runs business mofel programs
|